Evolutionary Coupling Analysis
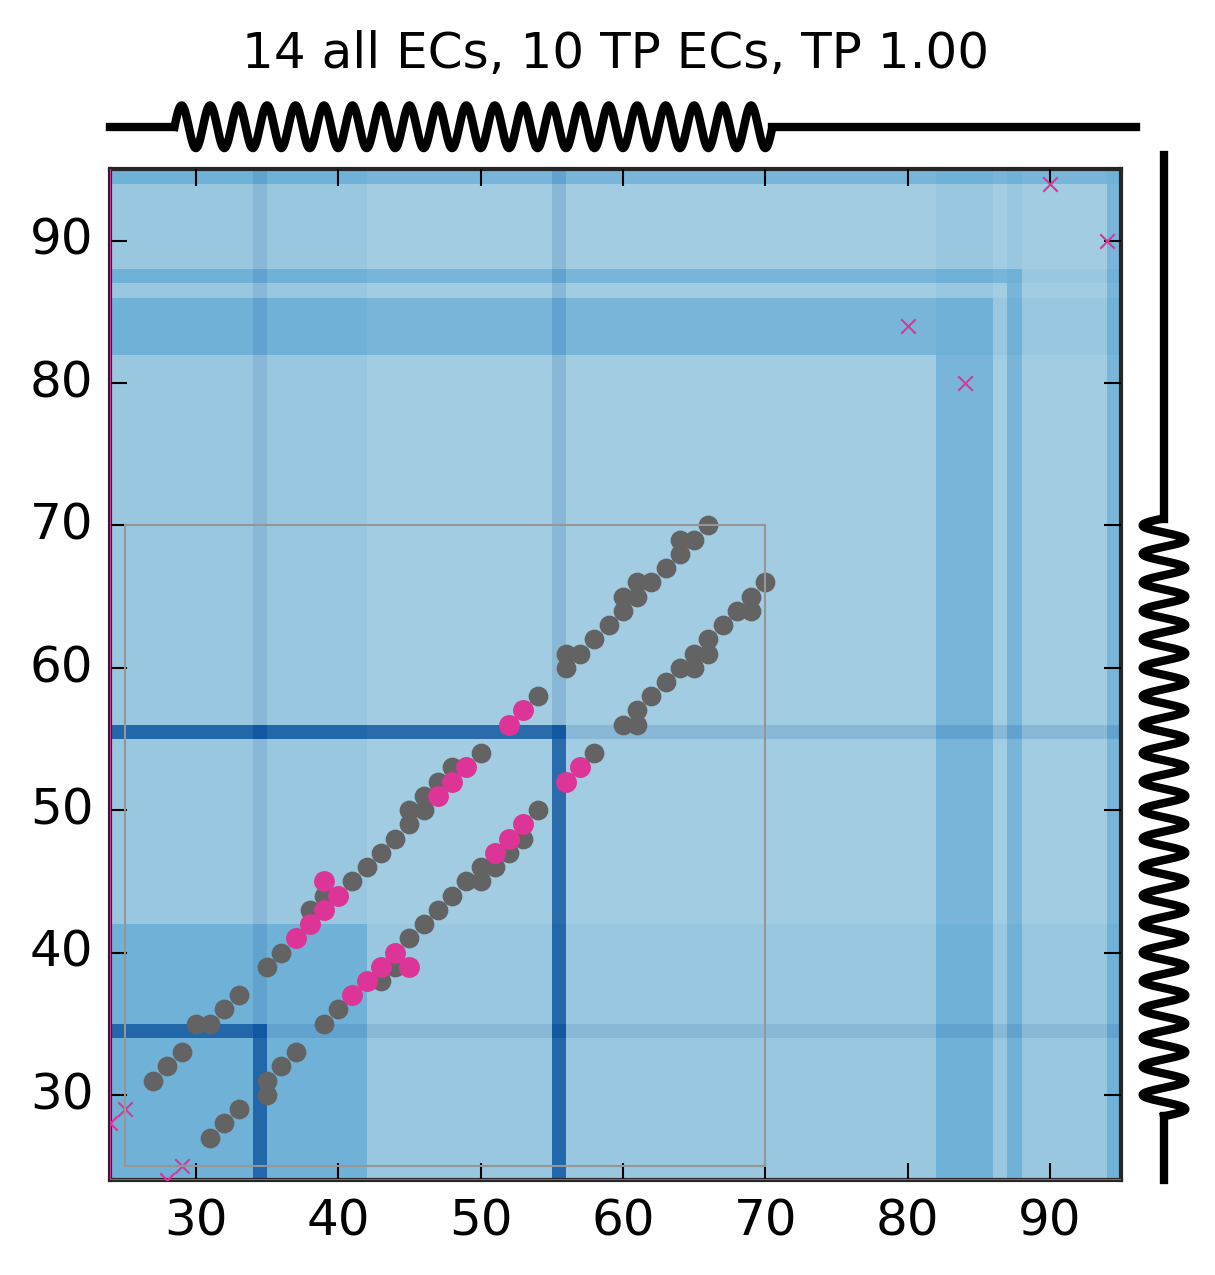
Predicted and experimental contacts
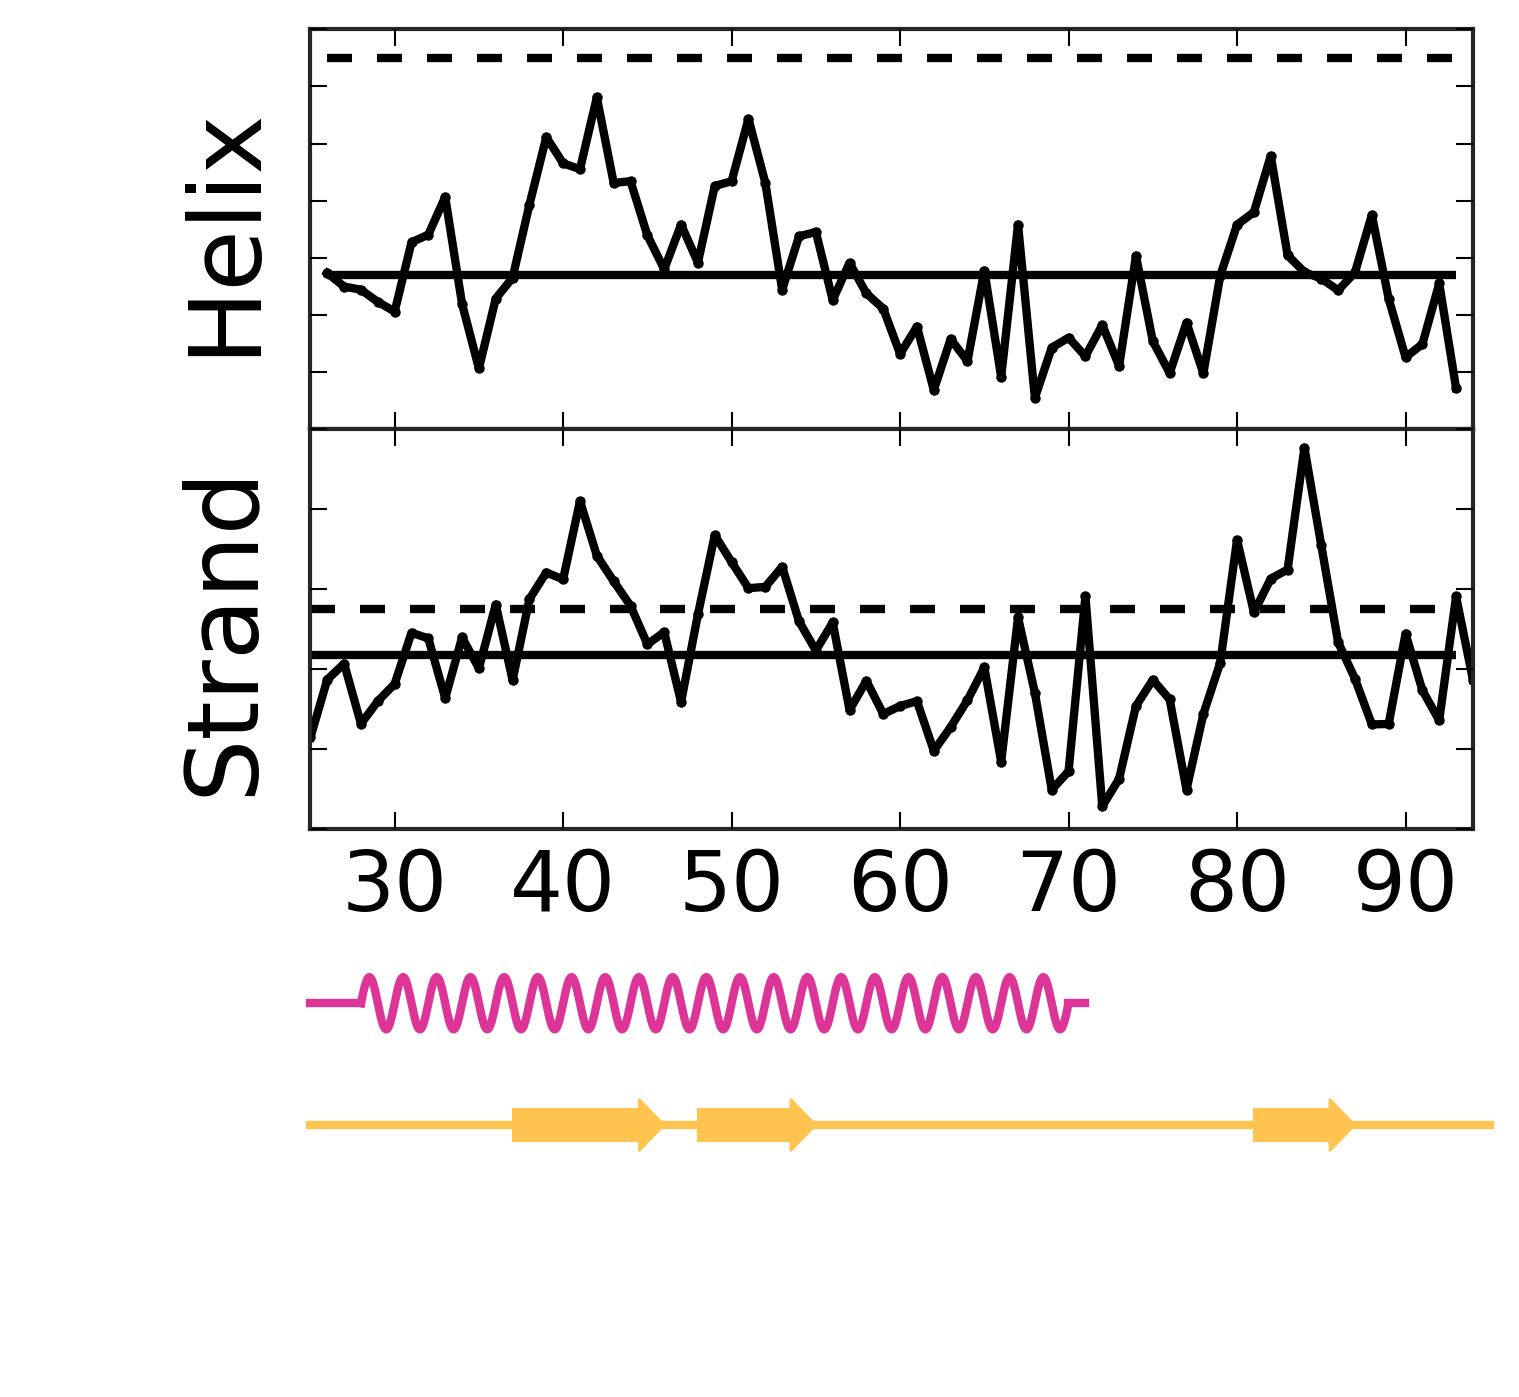
Secondary structure from ECs
EC score distribution and threshold
Top ECs
| Rank |
Residue 1 |
Amino acid 1 |
Residue 2 |
Amino acid 2 |
EC score |
| 1 |
40 |
A |
44 |
A |
0.78 |
| 2 |
38 |
Q |
42 |
R |
0.69 |
| 3 |
39 |
E |
43 |
Q |
0.67 |
| 4 |
37 |
R |
41 |
L |
0.63 |
| 5 |
24 |
E |
28 |
P |
0.62 |
| 6 |
90 |
S |
94 |
L |
0.61 |
| 7 |
49 |
K |
53 |
A |
0.61 |
| 8 |
80 |
A |
84 |
A |
0.60 |
| 9 |
53 |
A |
57 |
A |
0.59 |
| 10 |
25 |
E |
29 |
D |
0.56 |
| 11 |
52 |
Y |
56 |
E |
0.56 |
| 12 |
48 |
R |
52 |
Y |
0.52 |
| 13 |
47 |
E |
51 |
K |
0.52 |
| 14 |
39 |
E |
45 |
E |
0.51 |
Alignment robustness analysis
First most common residue correlation
Second most common residue correlation